
2022 Average Cost Per Lead and Cost Per Appointment Benchmarks
2022 Average Cost Per Lead and Cost Per Appointment Benchmarks
Updated Average Cost Per Lead Planning for 2022
How is that 2022 marketing plan coming along? Does your business feel upside down since COVID hit? If you are like a lot of our clients, you had the best of intentions to review your performance this year, compare it with 2020, and put a marketing plan together for 2022 before the turn of the New Year. But you are swamped and don’t have time for planning and tax season is around the corner and what does average cost per lead even mean and you need more help in the office!
Being busy is not a reasonable excuse when it comes to managing your business. Make time to focus on a few little things that will make a significant impact this year. Let’s focus on your lead cost.
- Do you know what your cost per lead was in 2020? 2019?
- Is that good? How much should a lead cost?
- Are you set up to track leads properly?
- What are your expectations for 2022?
We’ll get to those questions, but let’s start by looking back at your complete performance history for 2019 and 2020. You’ll want to look at the total amount you spent on marketing for all your lead sources: web presence, print materials, directories, mailings, TV, newspaper or other ads. Divide the total amount spent on marketing by the number of leads received and that’s your cost per lead.
Pro tip: Some of our clients are completely ignoring 2020 due to the April/May shutdown causing year-over-year confusion. Instead, they are comparing 2021 to 2019 and having a lot cleaner look at performance.
As you look at your records, make sure you use a consistent definition of a lead. Some consider every phone call or prospect to be a lead. Most businesses consider it a lead once you make a trip from your office to meet a qualified decision-maker and discuss work they want done.
So is your cost per lead any good? Lead cost can vary significantly by industry and lead source. Radio might have a higher cost per lead than a website, so if you are just starting to track your marketing performance, you’ll want to take a generalized number to smooth out inconsistencies in tracking.
You can evaluate how well you are doing by comparing yourself to industry averages. Here are some generalized cost-per-lead benchmarks by industry.
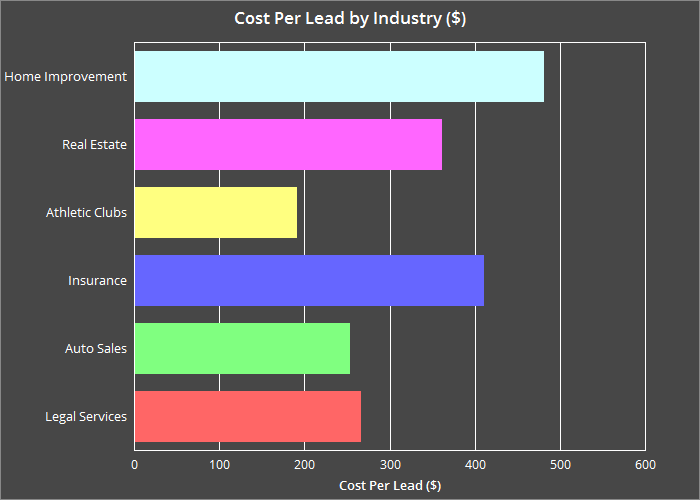
While the average cost per lead by industry can range from $187 (athletic club) to $480 (home improvement), it’s important to put those numbers in perspective. Some businesses track lead costs as a percentage of sales. Some industries have a high volume of leads and low average ticket price, which can contribute to low lead costs at higher than expected cost per conversion rates.
These broad generalizations can be really tricky because there is so much variability and tracking, but this gives a pretty good indication of what businesses must commit on average to create a successful lead flow. In looking over the numbers of several of these industries the cost per appointment by source varies from $5-$1,800+. So while these numbers are an important first broad stroke, it can really pay to take it one level deeper and break down your costs and leads by source.
Looking ahead, I recommend improving your lead tracking by source. It will allow you better track year-over-year performance and give you benchmarks specific to your business. You can create small goals for improvement and start to weed out under-performing sources and maybe take a chance or two investing in a new channel.
Cost per lead is stepping stone to several other statistics that can drive your business. Here are a few other ideas:
- What’s your average job size? (Divide annual revenue by number of jobs sold or transactions)
- Research your industry to find benchmarks including cost per lead, cost of marketing as a percentage of revenue, closing rate, average job size.
- Calculate the total lifetime value of a customer
- Create a top-line annual revenue goal and reverse engineer the math to formulate a path to achieving it. Here’s how you do the math:
Step 1: Revenue Goal / Average Job Size = Number of Jobs needed
Step 2: Number of Jobs / Closing Rate = Number of Leads required
Step 3: Number of Leads X Cost per Lead = Your Marketing Budget
Now you have the Revenue Goal, Cost Per Lead, Number of Sales, and Marketing Budget for your business.
Other things to consider: what lead sources generate the most business? What lead sources generate the most profitable jobs? What lead sources generate the most expensive leads, and are they worth the added expense?
It’s time to start taking lead tracking seriously.
Check out these other posts for more KPI info:
Revenue Per Employee
13 Free Marketing Ideas
15 Great Marketing Ideas
About the Author
Ben Lindberg, CR is a partner in Lion Tree Group, a marketing agency in Madison, WI. His expertise is in multi-platform brand messaging with a focus on inspiring homeowners. As an industry insider, he has walked the walk and developed a winning strategy from experience with one of Wisconsin’s largest remodeling companies. His agency specializes in digital design and branding face lifts. He regularly blogs on his company’s blog: The Bark and Roar.


